
February 2018 Property Investor´s Factfile
The Property Investor’s Factfile presents a range of relevant data from national / London house prices, the latest buy-to-let Limited Company (SPV) loan rates, LIBOR / SWAP rates and rentals to mortgage debt figures and information on the first-time buyer sector. Below are some noteworthy observations over the last month:
Property Market Trends
- Halifax reported both a slower level of annual house price growth alongside a drop in the number of new properties coming to market. Property prices in the 3 months to January 2018 were 2.2% higher than over the same period in 2017 (down from a 2.7% rise reported in December 2017 data). Prices have been flat on a quarter-on-quarter basis and the January data also reported an overall price drop of 0.6% (following a 0.8% fall in December 2017). Nonetheless, Russell Galley was reasonably upbeat on the current direction of the market: “Despite the recent rise in the Bank of England base rate, mortgage rates are still very low. This, combined with an ongoing acute shortage of properties for sale, will continue to underpin house prices over the coming months”;
- Halifax also also reported that new instructions for home sales have fallen for 23 consecutive months;
- Nationwide warned that the housing market is showing clearer indications of a slowdown. Joe Garner, chief executive at Nationwide commented: “Consumer spending, which has been a key driver of growth, has slowed noticeably, and almost three quarters of those surveyed in our Brexit Consumer Panel expressed concern about the rising cost of goods and services. Modest economic growth is also likely to hold back the housing market and house price growth”;
- The Royal Institute of Chartered Surveyors’ latest market “snapshot” reported that new buyer enquiries fell for the 10th month in a row across the UK. The number of newly agreed sales also dropped, prolonging the run of “negative readings” since February 2017. Simon Rubinsohn, chief economist at RICS commented that: “a lack of inventory on agents’ books continues to provide a major challenge with the number of valuations being undertaken not suggestive of a pick-up in new supply anytime soon. Should it emerge during 2018 that key service sectors’ access to the EU market will be more restricted post-Brexit than we assume in our forecast, this would likely affect house prices more negatively than we currently expect, especially in London where exposure is greatest”;
- Other regional-specific data by Hometrack’s Cities House Price Index reported year-on-year growth (up to December 2017) in Edinburgh (8.2%), Birmingham (7.5%), Glasgow (7.2%), Manchester (7.0%), Nottingham (6.5%), Liverpool (6.1%), Bristol (6.1%) amongst others. Slowdowns in price growth were seen in Oxford (-0.9%), Cambridge (-1.4%) and Aberdeen (-9.9%);
- The Land Registry’s December sales volume figures demonstrated that the number of concluded property transactions dropped by 8.5% year-on-year in October 2017 to 83,740. London saw the largest drop in sales volume, down 22% to 6,264;
- Between November and December 2017, the Land Registry reported 3.00% and 0.30% property price increases in the City of Westminster and the City of London respectively, a decline in Inner London [1] prices (-0.56%) and a marginal increase in Outer London [2] prices (0.05%);
- Rightmove reported that the portal had 141 million visits in January 2017 and a 2% rise in the number of properties coming to market relative to the previous year. According to Miles Shipside, a director at Rightmove: “With not enough supply of new-build properties, the market needs more churn from existing owners to get the healthy balance of buyer momentum without unhealthy property scarcity and consequently higher prices”;
- An excellent house price tool by the BBC (covering England and Wales) shows how real values (factoring in inflation) have performed since the Credit Crunch (thanks to @HenryPryor for sharing this resource on Twitter).
Rental Market Observations
- The most recent HomeLet Rental Index report indicated that average rents across the UK rose by 2.4% in January 2018 relative to January 2017 (average monthly rents are now £909). According to the data, average London rents are at £1,532 per month – increasing by 2.3% in January 2018. Excluding London, the average UK rental value was £760 at the start of the year, up 2.3% on 2017. Homelet’s interactive infographic may be of use to observe some broader rental market trends;
- Your Move’s latest Buy-to-Let Index indicated that average rents are up 2.3% year-on-year in England and Wales. Rental prices in the East of England grew faster than anywhere else (the average monthly rent grew by 3.3% over the course of 2017 to reach £893);
- For the 12 months up to January 2018, Landbay’s Rent Check reported increased rental values in Edinburgh City (3.8%), Leicester (3.7%), Nottingham (3.1%), West Lothian (2.9%), Peterborough (2.8%), Bristol (2.8%), Northamptonshire (2.8%), East Lothian (2.6%), Isle of Anglesey (2.6%) and Glasgow City (2.6%). Rental value drops were seen in Aberdeen City (-6.5%), Aberdeenshire, (-4.1%), Windsor and Maindenhead (-1.6%), Kingston-upon-Thames (-1.4%), Kensington and Chelsea (-1.4%), City of London (-1.3%), South Ayrshire (-1.3%), Hackney (-1.1%), Ealing (-0.9%) and Westminster (-0.9%);
- Please see other rental data and statistics in the RENTING section (page 2) of this months factfile.
English Housing Survey – Key Facts for Landlords and PRS Investors
Released towards the end of January 2018, the National Statistics English Housing Survey (2016-17) contained a number of interest statistics for private landlords to take note of:
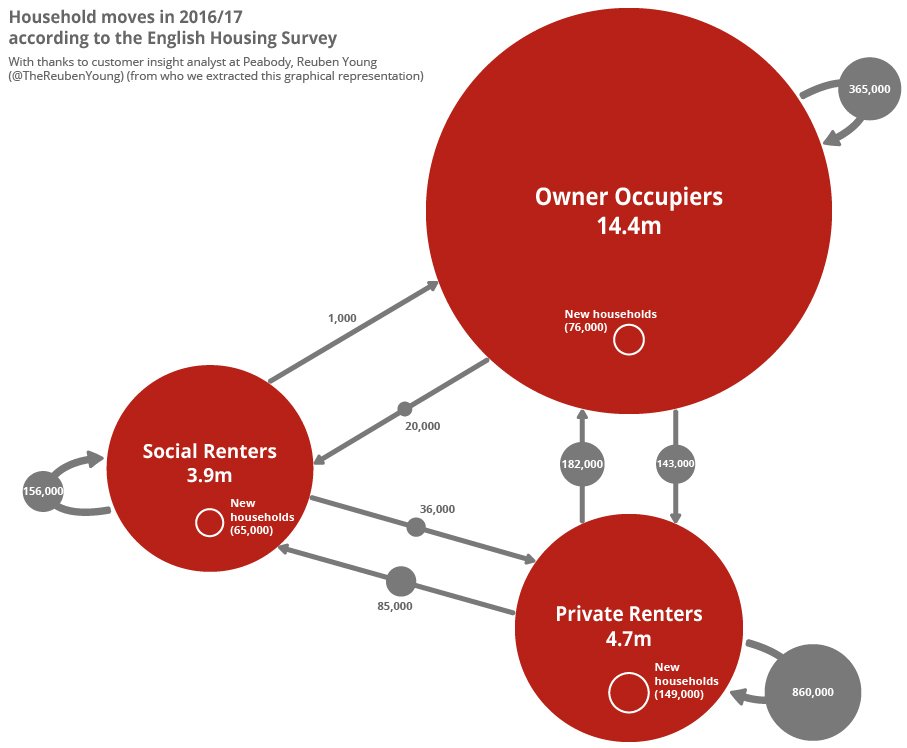
- 20% of households (4.7 million) live within the PRS, compared to 17% of households (3.9 million) in social rented accommodation;
- Outside of London, 36% of homeowners own unencumbered property; 30% own a property with a mortgage; 19% of households live within the PRS and 16% rent from either a housing association or the local authority;
- In London, 30% of households live within the PRS; 25% own their properties unencumbered; 22% own a property with a mortgage and 22% rent from either a housing association or the local authority;
- Widely reported in the media, although own occupancy levels have remained broadly stable, the number of 25 to 44-year olds homeowners has fallen by 20% since 2006-07 (52% now own their own home). The data also indicated that the 25 to 34 age group are more likely to remain in the private rented sector;
- Overcrowding was also said to be an ongoing issue, with 5% of private rented sector homes housing more people that they can actually handle;
- The graphical representation below, put together by customer insight analyst at Peabody Reuben Young (@TheReubenYoung), demonstrates the shifts in tenures highlighted in the research (each of the grey circles represent the number of people moving):
Macro-Economic Conditions for Buy-to-Let Property Investors / Traders
- Office of National Statistics data reported that consumer price inflation remains at 3% (for January 2018), the same level as in December;
- The debate continues over Bank of England’s Monetary Policy Committee future decision making, with a widening consensus that the first Bank Rise Rate increase will occur in May in response to comparatively bullish economic growth. Howard Archer (@HowardArcherUK), chief economic advisor at the EY Item Club believed that rates could be raised twice (to 1.0%) over the course of the year in spite of what may be a squeeze in consumer spending and other uncertainties (the most obvious being the Brexit negotiations). The EY Item Club sees a further interest rate hike to 1.25% in 2019 followed by a further two more in 2020 to 1.75%;
- Speaking to the FT, Samuel Tombs @SamuelTombs) from Pantheon Macroeconomics commented how the 0.25% BBR rise in NOvember 2017 did not pay attention to the effects on house prices which he believed was a “big oversight” (due to house prices’ influence on household confidence and spending). He commented that the “The MPC can’t ignore the evidence of a housing market slowdown now in front of them”;
- Data from Countrywide reported that private rented sector tenants paid £51.6 billion in 2018, over twice the level in 2007. The lettings network suggested that the “millenial generation” born between 1977 and 1995 have been paying the majority of aggregated rent across the UK;
- According to the Intermediary Mortgage Lenders Association (IMLA), mortgage interest relief restrictions, stricter mortgage underwriting processes and higher taxes to enter the buy-to-let industry have resulted in new investment into the sector falling from £25 billion in 2015 to £5 billion in 2017. With 4.5 million people in the sector, the IMLA has suggested that low rental property supply could result in growth in average rents. According to Kate Davies, IMLA’s executive director: “various interventions by government have apparently been aimed at encouraging more first time buyers and making investment in buy to let less attractive to existing and potential landlords. But the private rental sector plays a vital role in our housing supply and it’s essential that a sensible balance is struck, if tenants are not to be disadvantaged by shrinking stock and higher rents”;
- Research by UK Finance (formerly the Council of Mortgage Lenders) has shown that 1,200 buy-to-let mortgages were in “significant arrears” of over 10% of the outstanding balance in the last quarter of 2017 (a fifth higher than in the same quarter in 2016). 5,100 buy-to-let mortgages were in less serious arrears of 2.5% (a 2% rise relative to 2016);
- It is worth reading some recent research by S&P Global Market Intelligence which broadly concludes that the number of loss-making buy-to-let loans will grow as the percentage of relief on mortgage interest continues to erode over the next few years;
- The Financial Conduct Authority (FCA) raised further concerns over the 1.7 million interest-only mortgage borrowers, many of whom do not have a clear plan for capital repayment at the end of their terms. The regulator has told lenders to “step up” on the number of checks, estimating a series of peaks in maturing loans in 2027, 2028 and 2032;
- A survey by the British Property Federation (BPF) revealed the 73% of its members think that Brexit-induced economic and political uncertainty will be the largest business challenge over the course of 2018. According to the collected data, confidence in the UK property sector remains at an “historic low” at 48% in 2017, compared to 88% in 2015 (although most responders stated that they plan to increase investment and development in 2018). 29% are confident that Theresa May’s government will secure a successful Brexit deal, contrary to 58% who think the opposite. Melanie Leech, chief executive of the BPF commented: “It is clear that a two-year implementation period to ensure we avoid a cliff-edge scenario in 2019.”
Buy-to-Let Investing / Financing Conditions
- The “Funding for Lending” government scheme, that lent banks and building societies huge quantities of finance at competive rates, came to an end at the start of February. The £140 billion Term Funding Scheme, another cheap financing mechanism created in 2016 in the aftermath of the Brexit decision, will also come to an end at the end of February (although banks and building societies still have a four-year pay back period). The sea change may result in lending institutions being forced to attract more expensive saver deposits and other market sources to raise capital. For the time being, it would therefore seem that historically low mortgage rates may be coming to an end;
- At the end of December 2017 and January 2018, the monthly average LIBOR (Sterling) had not been updated on the Bank of England’s website – however both the 1 year and 5 year SWAP rates s increased by 0.072 and 0.245 points respectively;
- Data from Mortgages for Business reported that the proportion of buy-to-let mortgages available to Limited companies (Special Purpose Vehicles) grew to almost 25% in the last quarter of 2017;
- Attractive buy-to-let SPV mortgage rates continue to be featured in this month’s property investor’s factfile include a Barclays fixed 2.79% pay rate until the end of January 2023 with a £1,950 arrangement fee (a similar product is available without the arrangement fee, but with a higher pay rate of 3.19%). The State Bank of India is also offering a 5-year SPV mortgage with a 3.24% tracker pay rate and a £937 loan fee. For more information and to discuss your specific borrowing circumstances please get in touch with paul.lowcock@bespokefinance.info or direct on 01133 203240;
- For those who have not had the chance to check it recently, BM Solutions’ full rental income calculator checks the eligibility for buy-to-let loans prior to submitting a case. To see the results, enter the number of applicants, type, income, product rate, term length, maximum loan to value, property value, loan required and anticipated monthly rental income. Note the disclaimer that the calculations are for illustrative purposes only and do not represent a full mortgage offer;
- Please see our recent post on mortgage underwriting (within the buy-to-let sector) for some insights into the key influences of buy-to-let mortgage payrates.
First-Time Buyers / Help to Buy
- The latest Help to Buy figures from Private Finance have shown that there were 32,180 completions of purchases using the equity loan in the first 9 months of 2017 (an increase of 23% relative to 2016). It is estimated that 13,423 buyers who purchased with the first tranche of Help to Buy loans in 2013 will need to start paying interest (in addition to their mortgage costs) from April 2018.
Please feel free to follow us on Twitter and receive regular updates of relevance to property investors via our Facebook page. If you have not already, we would also encourage you to subscribe to our monthly e-bulletin (and receive our latest e-book and comprehensive buy-to-let financial calculator). Please click on the animation below for more information and to fill in your details in the “PLEASE LEAVE YOUR DETAILS HERE” box.

[1] The Land Registry classifies Inner London as constituting the following boroughs: Camden, City of London, Hackney, Hammersmith & Fulham, Haringey, Islington, Kensington and Chelsea, Lambeth, Lewisham, Newham, Southwark, Tower Hamlets, Wandsworth and Westminster.
[2] Informally referred to as the “donut” areas of London: Barking & Dagenham, Barnet, Bexley, Brent, Bromley, Croydon, Ealing, Enfield, Greenwich, Harrow, Havering, Hillingdon, Hounslow, Kingston upon Thames, Merton, Redbridge, Richmond on Thames, Sutton and Waltham Forest.